
Behind The Design: The Eye Chart And How It Is Used To Test Vision
Behind The Design is a segment by DesignTAXI where we wind back to the pioneering products and icons that steered the design world forward and transformed consumer perceptions forever.
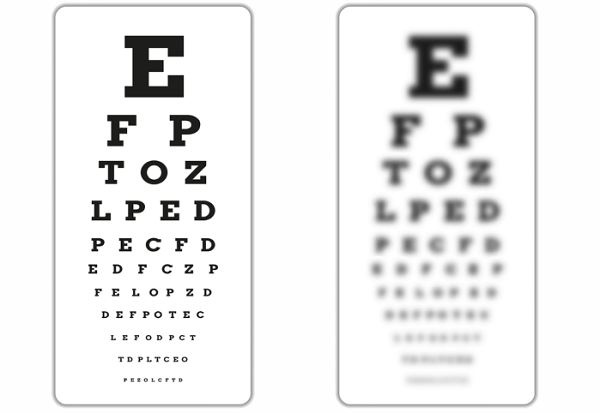
Image via Shutterstock
The chart used by eye care professionals to measure visual acuity, called the Snellen Eye Chart, was developed by Dutch ophthalmologist Hermann Snellen back in 1862. It continues to be used globally by medical professionals over 100 years on.
The classic chart features big and little letters, known as “optotypes.” It has 11 lines of block letters, beginning with large letters on the top row. While the number of letters on each row increases from top to bottom, the size of these letters progressively decreases.
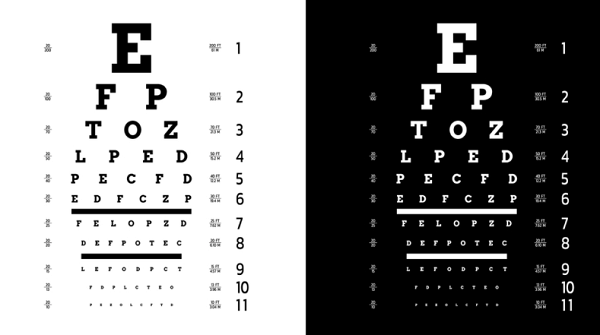
Image via Shutterstock
When testing for visual acuity, the patient is seated from a distance of 20 feet from the chart. With one eye covered, they are asked to identify the characters from the top to bottom. The test is repeated with the other eye, and then with both eyes uncovered.
The results of the acuity exam will determine the quality of your eyesight. More specifically, the smallest row of letters that the patient can read accurately determines the visual acuity of the uncovered eye.
If you have normal visual acuity, it would be defined as 20/20. If you have a worse-than-normal vision, you would score a ratio of less than one, like 6/10. A ratio greater than one, like 6/5, indicates better-than-normal vision.
The Snellen eye chart has been criticized throughout the years as a true indicator of the quality of vision. Among the complaints is the unregulated spacing between letters and rows across different Snellen charts. Another suggests that the chart is designed against the user, as with the number of letters increasing per line, it might lead to “visual overcrowding” and difficulty in reading each letter.
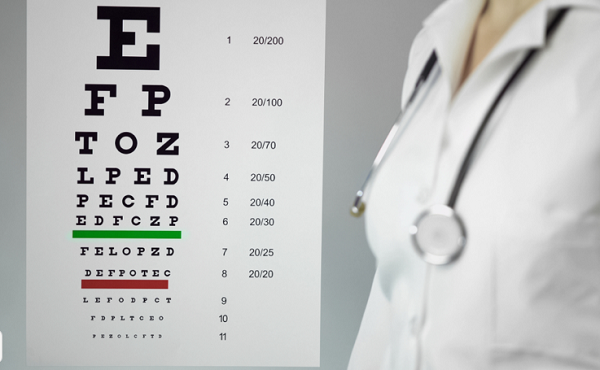
Image via Shutterstock
[via Britannica, cover image via Shutterstock]
Image via Shutterstock
The chart used by eye care professionals to measure visual acuity, called the Snellen Eye Chart, was developed by Dutch ophthalmologist Hermann Snellen back in 1862. It continues to be used globally by medical professionals over 100 years on.
The classic chart features big and little letters, known as “optotypes.” It has 11 lines of block letters, beginning with large letters on the top row. While the number of letters on each row increases from top to bottom, the size of these letters progressively decreases.
Image via Shutterstock
When testing for visual acuity, the patient is seated from a distance of 20 feet from the chart. With one eye covered, they are asked to identify the characters from the top to bottom. The test is repeated with the other eye, and then with both eyes uncovered.
The results of the acuity exam will determine the quality of your eyesight. More specifically, the smallest row of letters that the patient can read accurately determines the visual acuity of the uncovered eye.
If you have normal visual acuity, it would be defined as 20/20. If you have a worse-than-normal vision, you would score a ratio of less than one, like 6/10. A ratio greater than one, like 6/5, indicates better-than-normal vision.
The Snellen eye chart has been criticized throughout the years as a true indicator of the quality of vision. Among the complaints is the unregulated spacing between letters and rows across different Snellen charts. Another suggests that the chart is designed against the user, as with the number of letters increasing per line, it might lead to “visual overcrowding” and difficulty in reading each letter.
Image via Shutterstock
[via Britannica, cover image via Shutterstock]
Also check out these recent news


