
CDC Introduces Water-Tracking Map To Chart Spread Of COVID-19 From Pee
As the Omicron wave swept across the country, medical staff struggled to deal with never-before-seen hospitalization numbers. Furthermore, the lack of rapid antigen tests available meant that asymptomatic individuals couldn’t find out if they had contracted COVID-19.
To address these gaps in tracking the spread of the virus, the Centers for Disease Control and Prevention (CDC) has introduced new tracking tools, including data from the National Wastewater Surveillance System (NWSS), to monitor levels of COVID-19 spread in the various regions.
Even if a patient is asymptomatic, he or she will shed fractions of the virus during trips to the toilet, explained the agency. This enables the presence of SARS-CoV-2 to be detected in wastewater, thus allowing authorities to chart the spread of the virus within specific communities.
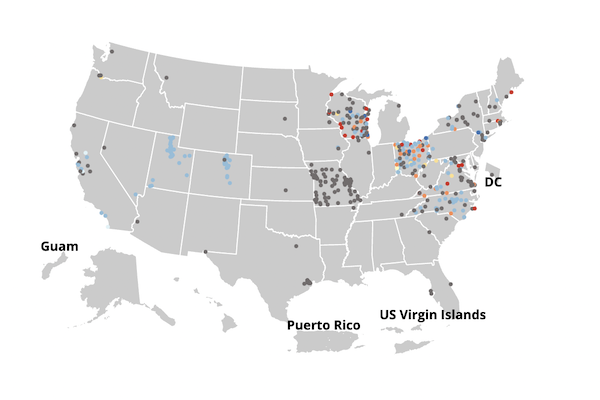
If you’d like to get a better idea of the situation in your residential area, simply search for your state and county on the site’s interactive map. Color-coded dots will display the levels of COVID-19 in the area, and how much it’s increased or decreased over the last fortnight.
According to Fast Company, the data collected from wastewater treatment plants is updated at 8pm ET (5pm PT) every evening to provide real-time information. However, the map is currently littered with gray dots, an indication that not enough data has been collated in the area.
As more data gets collected over the coming weeks, chances are the map will gradually be updated to display virus levels across more regions throughout the country.
Not only does this information alert residents to the situation in their county, but it also provides an early warning of forthcoming surges or the appearance of a new variant, said the CDC.
As per Water & Wastes Digest, several communities in the nation had detected the Omicron variant in their wastewater before any residents in the area reported contracting the specific strain of COVID-19.
“These data are uniquely powerful because they capture the presence of infections from people with and without symptoms, and they’re not affected by access to health care or availability of clinical testing,” said Amy Kirby, Program Lead for the NWSS.
[via Fast Company and Water & Wastes Digest, cover image via Centers for Disease Control and Prevention]


