
Microsoft Introduces Python Into Excel To Amp Up Productivity For Coders

Microsoft has just unveiled the public preview of its Python integration within Excel. For those working with coding, melding Python scripts and Excel formulas in a single workbook can aid in streamlining data manipulation and analysis.
It seems like Python will be a native integration into the app, and users can access the Python add-on directly through the Excel ribbon. This allows users to analyze advanced statistics without going through a new learning curve. On top of that, Excel’s built-in connectors and Power Query allows the app to import external data through Python in your workflow.
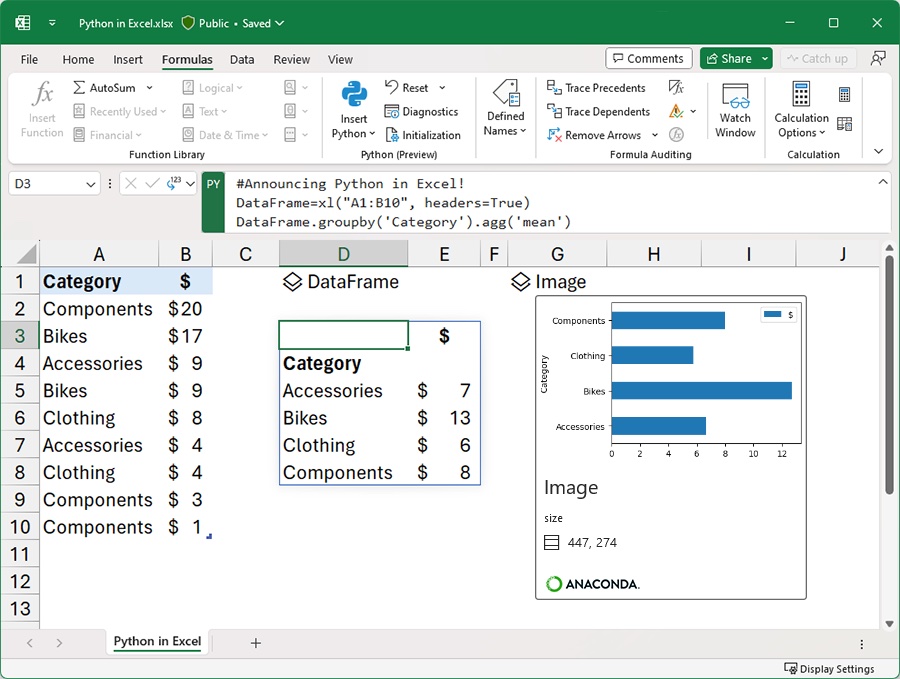
Stefan Kinnestrand, general manager of modern work at Microsoft, explains, “You can manipulate and explore data in Excel using Python plots and libraries, and then use Excel’s formulas, charts, and PivotTables to further refine your insights.”
Microsoft partnered with the data science platform Anaconda to bring this project to fruition. This collaboration leverages the Anaconda Python distribution via the Azure ecosystem. Consequently, users can now harness popular Python libraries like Matplotlib and seaborn for data visualization.
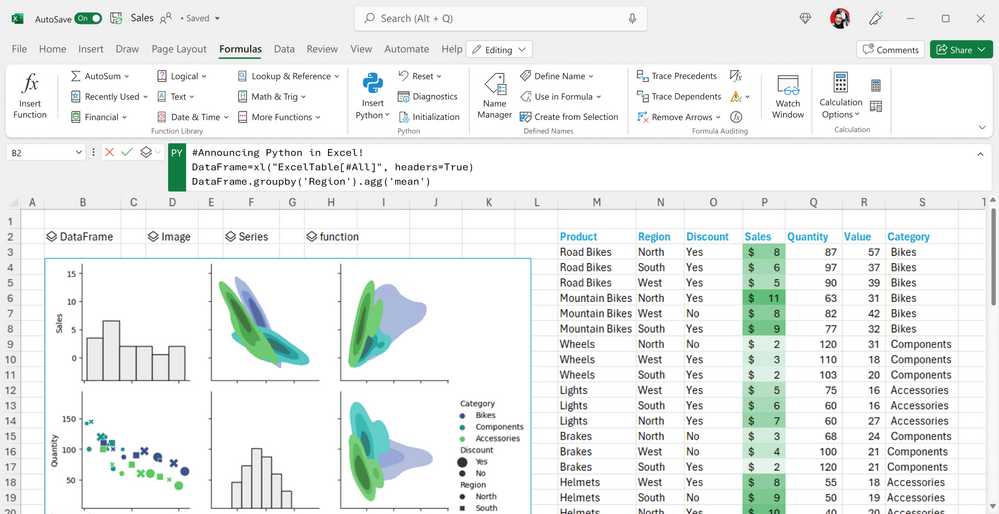
The feature is initially rolling out exclusively to Microsoft 365 Insiders, forming part of the Excel for Windows beta channel, and these calculations will initially take place in the Microsoft Cloud.
To access this feature, users must join the Microsoft 365 Insider Program and opt for the beta channel to unlock the latest Excel builds.
[via TechCrunch and TechTimes, images via various sources]


